Happy May, everyone! As promised, each month, we will provide a marketing performance update of The 100 Collection and our efforts for our partners.
This analysis highlights those quick wins—keyword movements and high-volume traffic that can drive valuable impact. From optimizing SEO and content strategy to leveraging data-driven optimization and brand storytelling, these recommendations are designed to reach a broader audience and maximize the value that we offer all of you!
Quick Wins + Highlights
To understand keyword movement, it's important to understand that it can take anywhere from a few days to a few months (or more) to start ranking for these keywords, and continuous optimization of articles and landing pages that target each keyword is how we start to rank in a higher position for each word/phrase.
Here are a few of our top movements where we saw the most growth:
Keyword Movement
These are all tracked via Ahrefs, but we also use SEMRush for further keyword movements and position tracking...
- "tybee vacation rentals" moved up 45 positions from the previous month
- "cabin rentals in blue ridge mountains ga" moved up 47 positions from the previous month
- "bahamas vacation home rentals" moved up 64 positions from the previous month
- "beach house rentals san diego ca" moved up 36 positions from the previous month
Top Performing Pieces of Content
Alongside keyword movement and positioning, our top performing pieces of content are the articles and blogs that we've posted that have seen the most traffic (views/users) for April, 2025.
- Quick Getaways from Atlanta: Ideal Long Weekend Road Trips
- Quick Getaways from Norfolk, VA: Long Weekend Road Trips
- 8 Perfect Destinations For A Romantic Fall Getaway
- Your Guide To The Perfect Long Weekend in Finger Lakes, NY
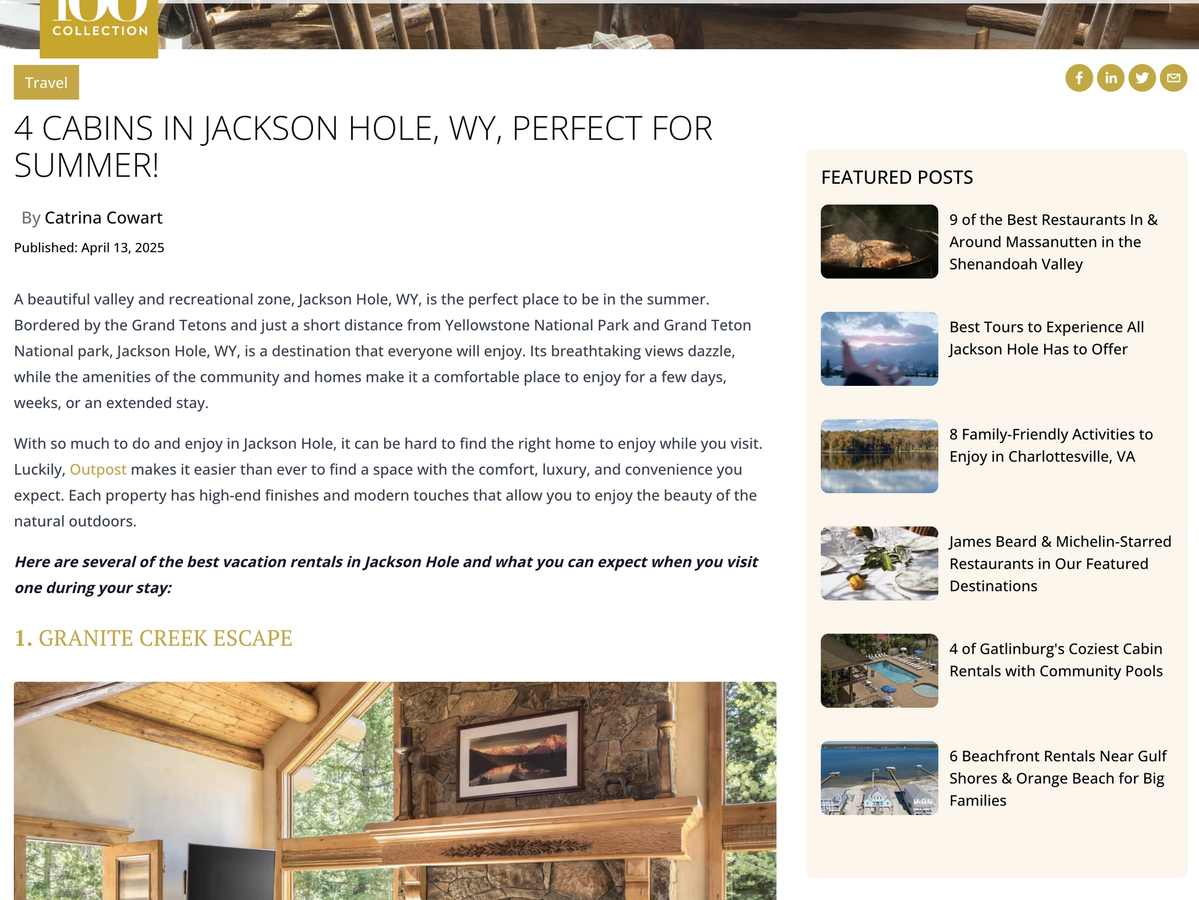
- 4 Cabins in Jackson Hole, WY, Perfect for Summer!
- Scenic Fall Getaways: 8 Instagrammable Autumn Travel Destinations
- Everything You Need to Know About Planning A Trip to Topsail Island, NC
- The Best Holden Beach Seafood Restaurants and Markets
- 6 Spectacular Summits Near Asheville, NC
- 4 Reasons You Should Plan a Trip to St. Simons Island, GA
- The Ultimate Guide to Transportation In and Around Washington D.C.
- 6 Stunning Beachfront Rentals in Destin, FL
- The Everything Guide to Planning A Park City, Utah Guys' Trip
- 5 Secluded Lake House Rentals in Lake Keowee, Clemson, and Lake Hartwell for A Tranquil Getaway
- Your Guide to the Perfect Long Weekend on Isle of Palms, SC
Google Analytics (GA4) Insights
Rankings and traffic change constantly. New blogs get a lot of traffic when it starts to rank, old blogs can lose traffic overtime if stale, and the numbers in Google Analytics can fluctuate when looking at a smaller scope of numbers (like 7 day increments).
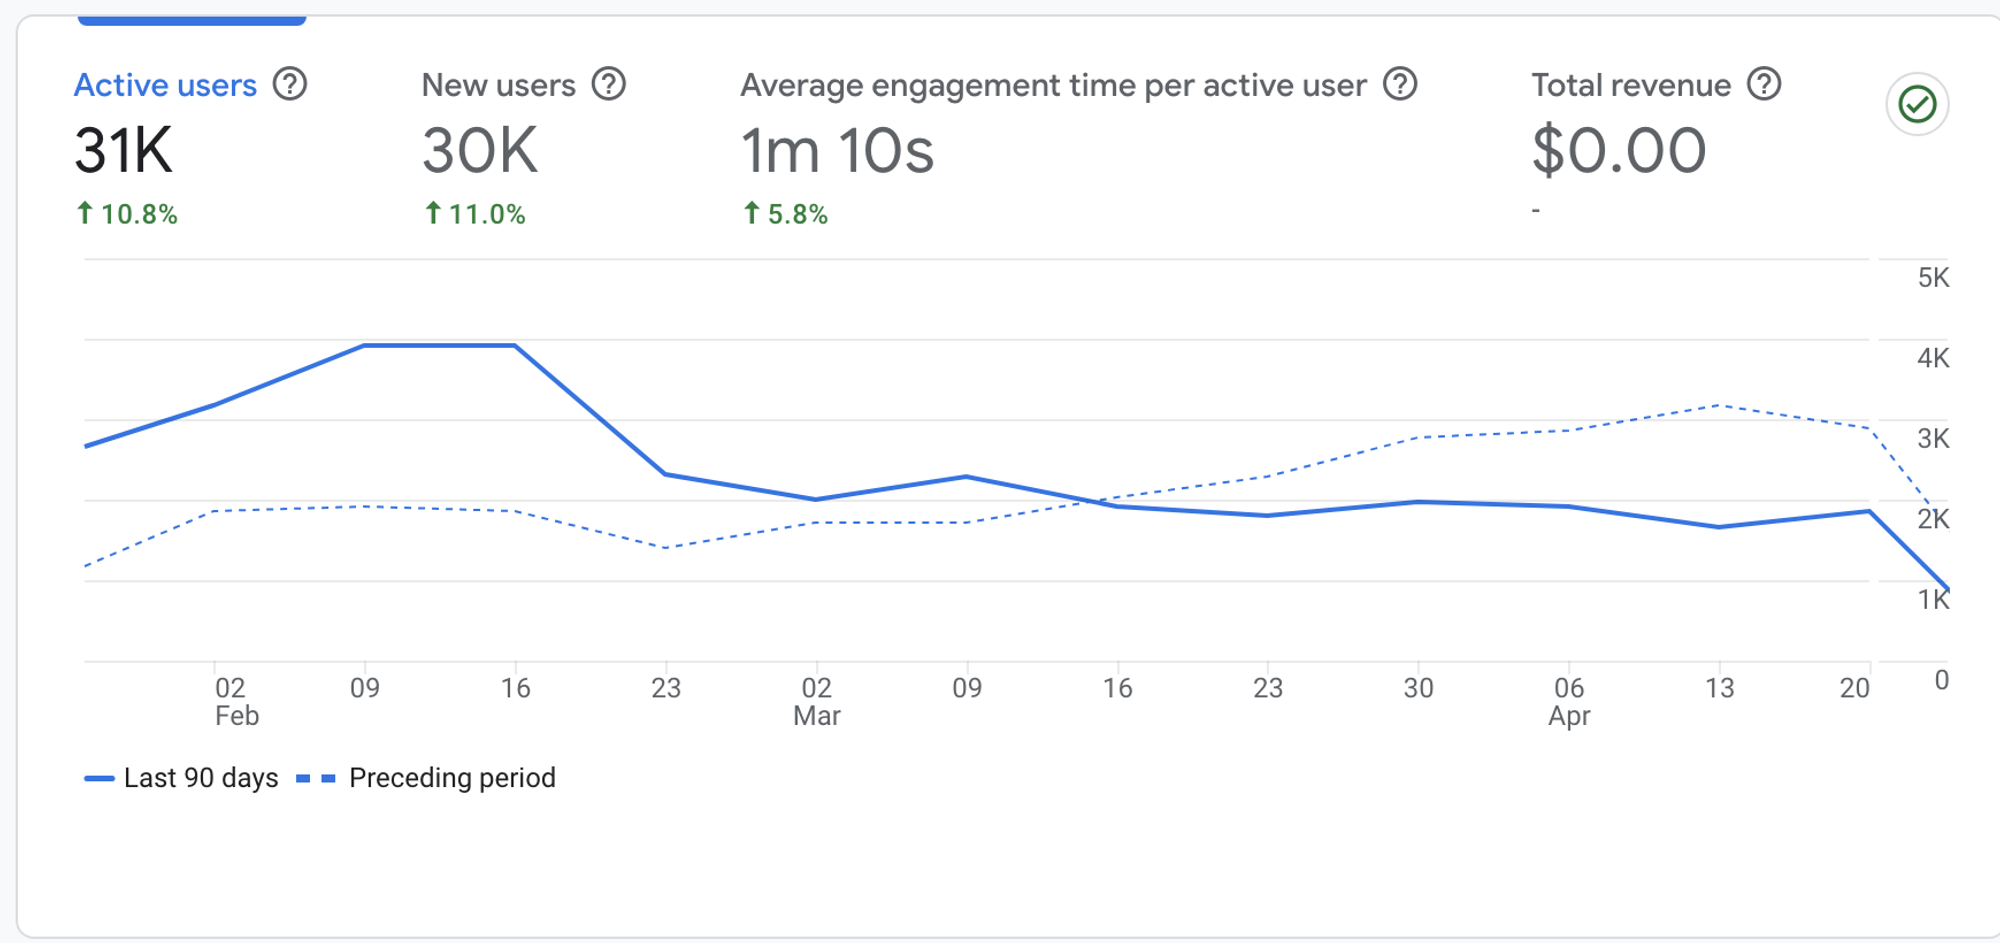
In order to get a broader scope of how your site and its pages are doing, it's best to look at either a 30-day or 90-day period and compare it to the preceding period. Here, we've compared in 90-day increments in order to fully understand the bigger scope of our data.
For the past 90 days, we are up 20.91% of views compared to its preceding period. Active users are up 10.81% . Average engagement time is up 5.75%. This is the amount of views that we are receiving to our overall pages as well as how many people are actively engaging (scrolling, clicking) with our pages.
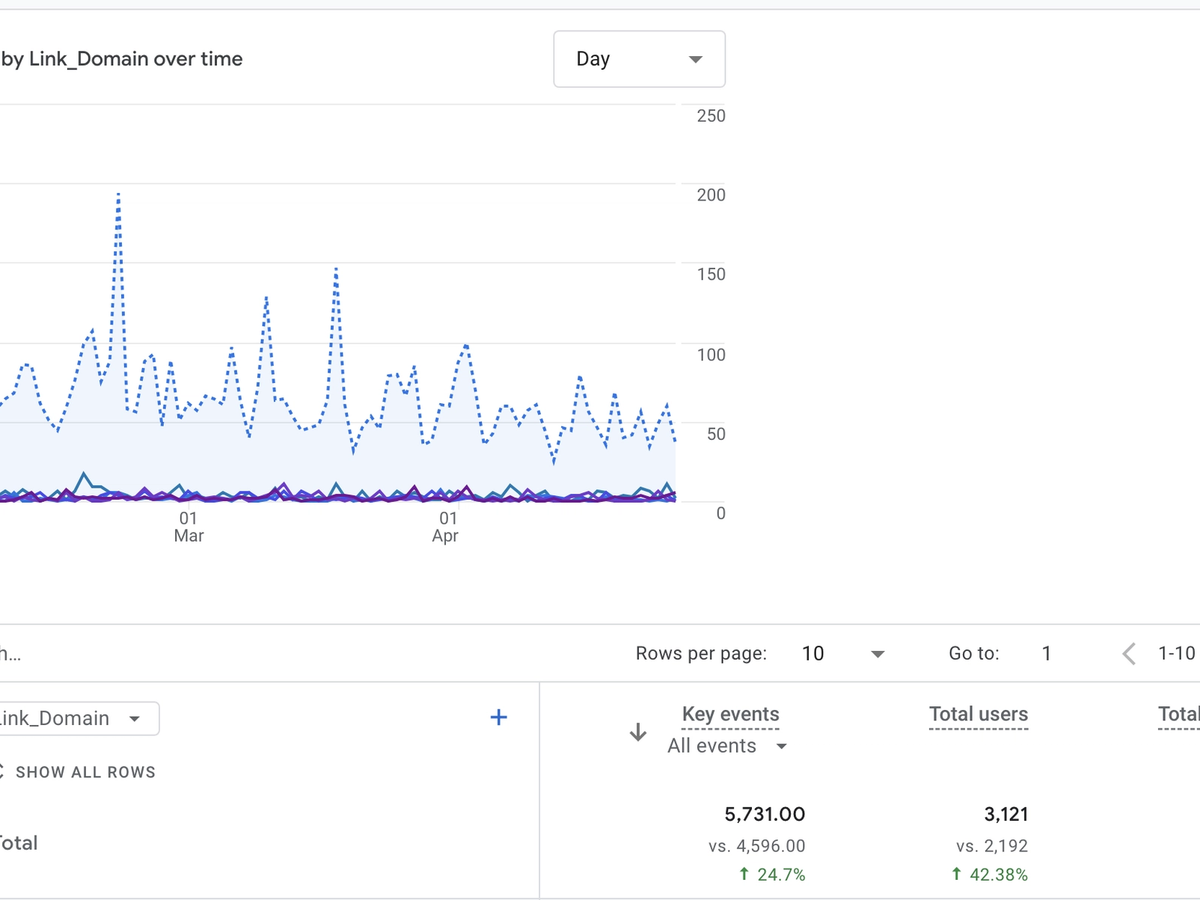
Our referral events to partner sites are up 24.70% total.
When looking at year/year data, we are up 256.00% for active users, up 158.87% for views to pages, and up 112.68% to referrals to our partners.
blurb
Thank you all again for your continued partnership!