Hello! Hope everyone has had a wonderful Summer as we're gearing up for cooler weather and cozy, autumn months ahead :)
As promised, each month, we will provide a marketing performance update of The 100 Collection™ and our efforts for our partners.
This analysis highlights those quick wins—keyword movements and high-volume traffic that can drive valuable impact. These recommendations are designed to reach a broader audience and maximize the value that we offer all of you!
Quick Wins + Highlights
To understand keyword movement, it's important to understand that it can take anywhere from a few days to a few months (or more) to start ranking for these keywords, and continuous optimization of articles and landing pages that target each keyword is how we start to rank in a higher position for each word/phrase.
Here are a few of our top movements where we saw the most growth:
Keyword Movement
These are all tracked via Ahrefs, but we also use SEMRush for further keyword movements and position tracking...
- "bahamas villas rental" moved up 70 positions from the previous month
- "nashville vacation home rentals" moved up 67 positions from the previous month
- "holden beach vacation rentals oceanfront" moved up 53 positions from the previous month
- "vacation rentals asheville north carolina" moved up 52 positions from the previous month
- "asheville nc vacation rentals" moved up 46 positions from the previous month
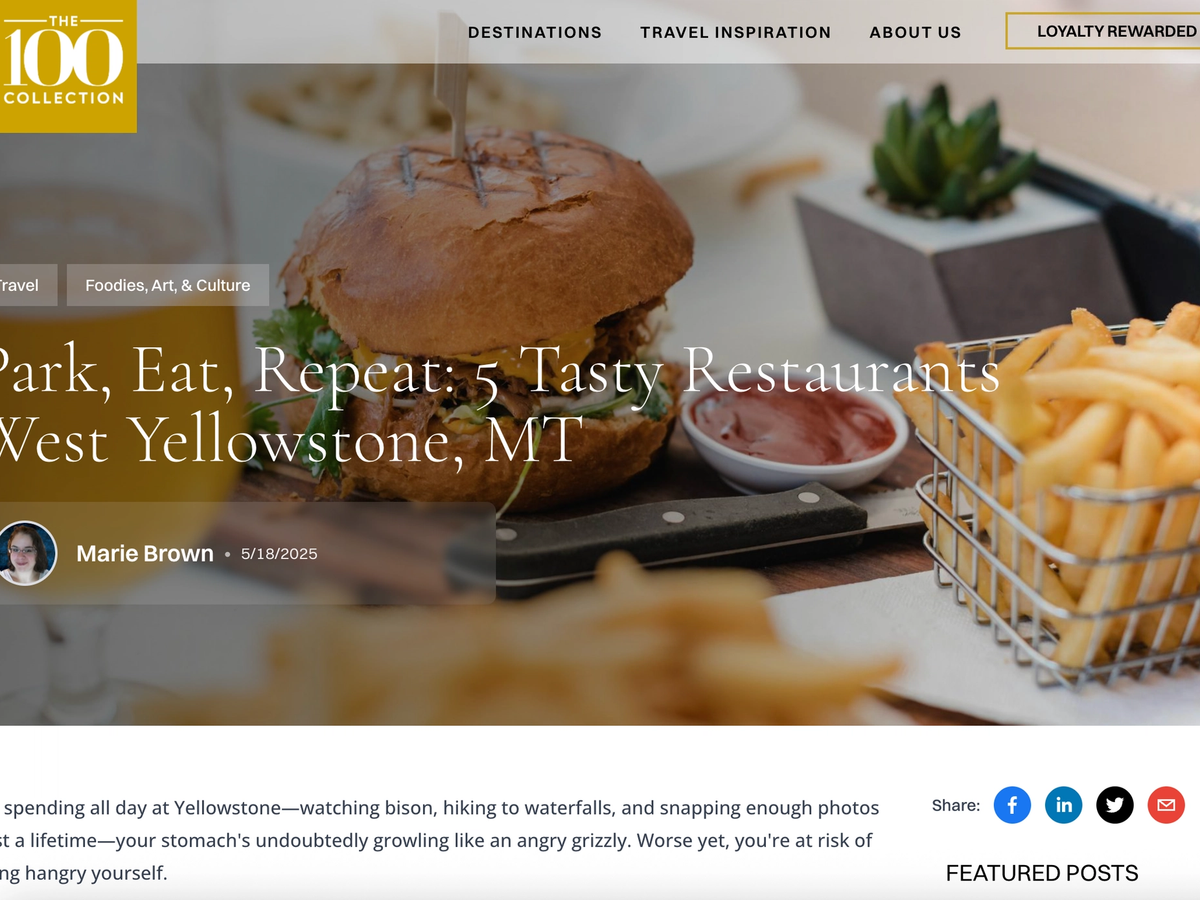
Top Performing Pieces of Content
Alongside keyword movement and positioning, our top performing pieces of content are the articles and blogs that we've posted that have seen the most traffic (views/users) for August, 2025.
To showcase some more of our blogs, we've lumped our quick getaways and long weekends into one bullet point up top! Here are some other popular blogs to checkout.
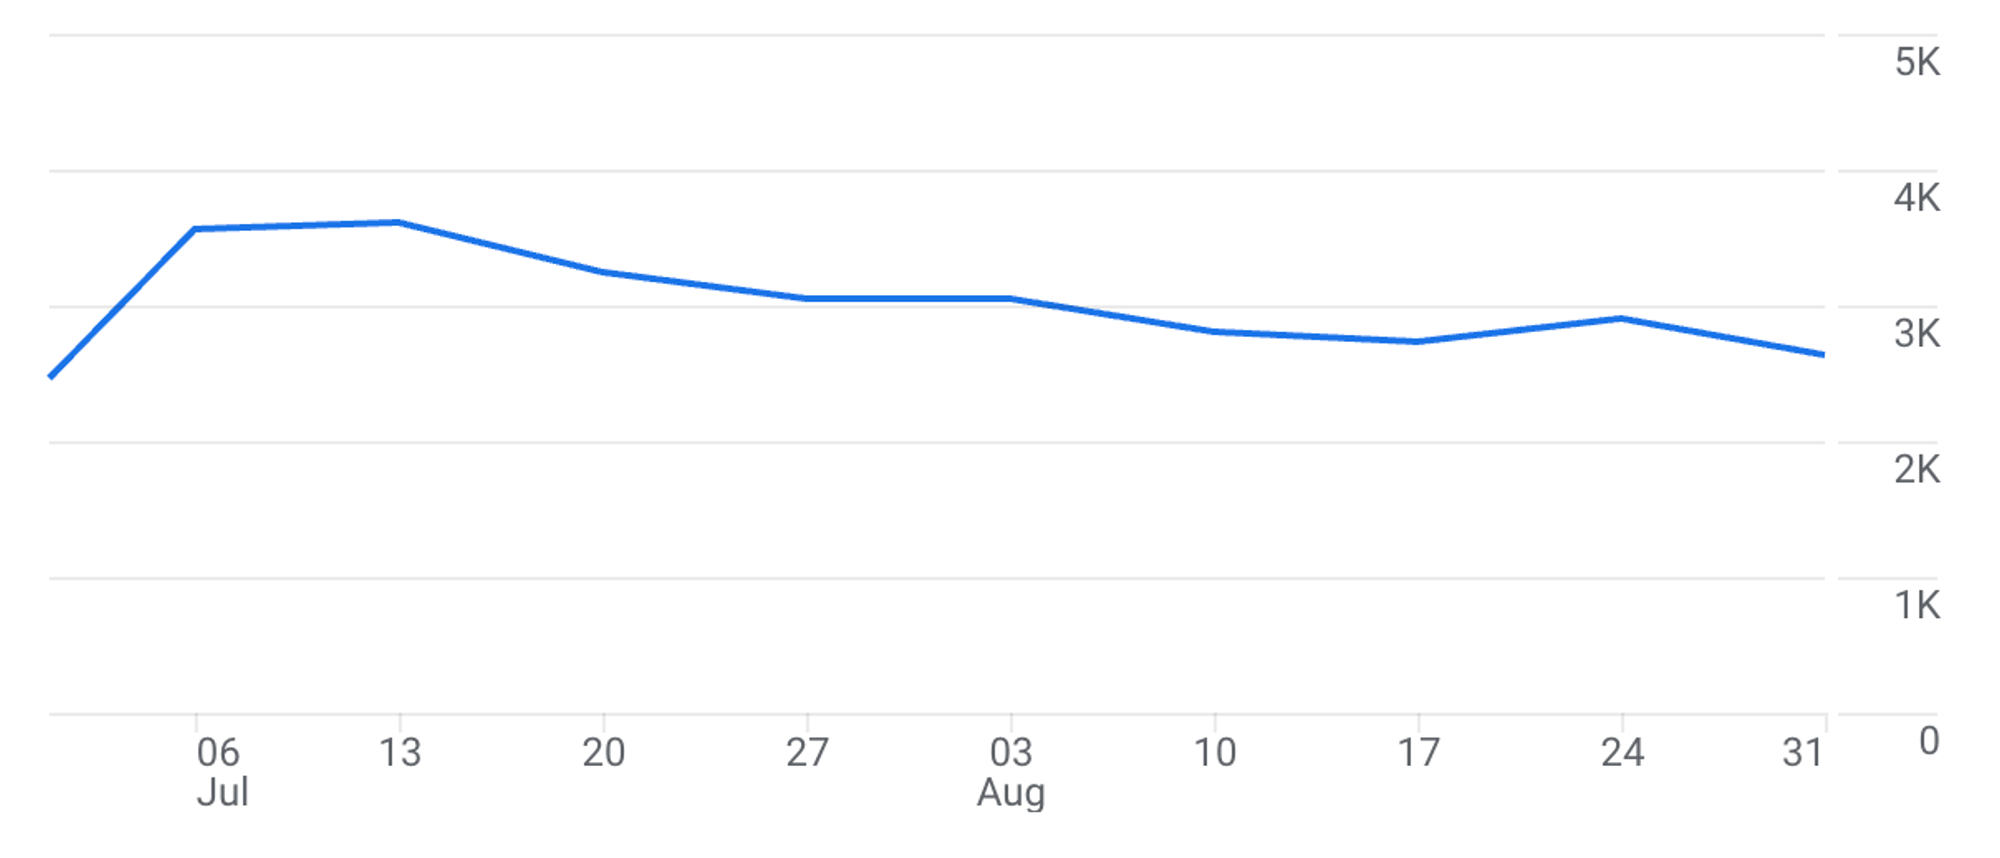
Google Analytics (GA4) Insights
Rankings and traffic change constantly. New blogs get a lot of traffic when it starts to rank, old blogs can lose traffic overtime if stale, and the numbers in Google Analytics can fluctuate when looking at a smaller scope of numbers (like 7 day increments).
In order to get a broader scope of how your site and its pages are doing, it's best to look at either a 30-day or 90-day period and compare it to the preceding period. Here, we've compared in 90-day increments in order to fully understand the bigger scope of our data.
For the past 90 days, we are up 2.88% of views compared to its preceding period. Users are up 8.55%. Average engagement time is slightly down 3.18%. This is the amount of views that we are receiving to our overall pages as well as how many people are actively engaging (scrolling, clicking) with our pages.
Our referral events to partner sites are up 17.03% total.
When looking at year/year data, we are up 151.70% for active users, up 143.81% for views to pages, and up 59.03% to referrals to our partners.
When looking at our /travel inspiration page (that we just redesigned), it received 42.34% of more views that it's preceding month!
Thank you all again for your continued partnership!