Happy April, everyone! As promised, each month, we will provide a marketing performance update of The 100 Collection and our efforts for our partners.
This analysis highlights those quick wins—keyword movements and high-volume traffic that can drive valuable impact. From optimizing SEO and content strategy to leveraging data-driven optimization and brand storytelling, these recommendations are designed to reach a broader audience and maximize the value that we offer all of you!
Quick Wins + Highlights
To understand keyword movement, it's important to understand that it can take anywhere from a few days to a few months (or more) to start ranking for these keywords, and continuous optimization of articles and landing pages that target each keyword is how we start to rank in a higher position for each word/phrase.
Here are a few of our top movements where we saw the most growth:
Keyword Movement
These are all tracked via Ahrefs, but we also use SEMRush for further keyword movements and position tracking...
- "villa amelia island" moved up 49 positions from the previous month
- "jackson hole rentals" moved up 34 positions from the previous month
- "abode luxury rentals" moved up 27 positions from the previous month
- "luxury short term rentals" moved up 41 positions from the previous month
Top Performing Pieces of Content
Alongside keyword movement and positioning, our top performing pieces of content are the articles and blogs that we've posted that have seen the most traffic (views/users) for March, 2025.
As you can see here, our Quick Getaways posts are still doing really well! We are also starting to get some continuous traction on our stand-alone posts where we talk about specific destinations.
This upcoming month, we've got over 20 stand-alone articles in the funnel, as well as some more round-up posts that will gain a lot of traction and visitors to the area.
What you can expect for round-up posts: Exclusive Amenities Offered from Our Partners, James Beard and Michelin Star Restaurants in Each Area, Tips to Understanding Different Cultures As You Travel.
What to expect for our stand-alone posts per destination: 5 Amazing Cabins with Hot Tubs in Harpers Ferry, Top Restaurants & Things to Do in Myrtle Beach, Top Things to Do in San Diego, 9 Breathtaking Los Cabos Vacation Rentals and Villas, & more!
Google Analytics (GA4) Insights
Rankings and traffic change constantly. New blogs get a lot of traffic when it starts to rank, old blogs can lose traffic overtime if stale, and the numbers in Google Analytics can fluctuate when looking at a smaller scope of numbers (like 7 day increments).
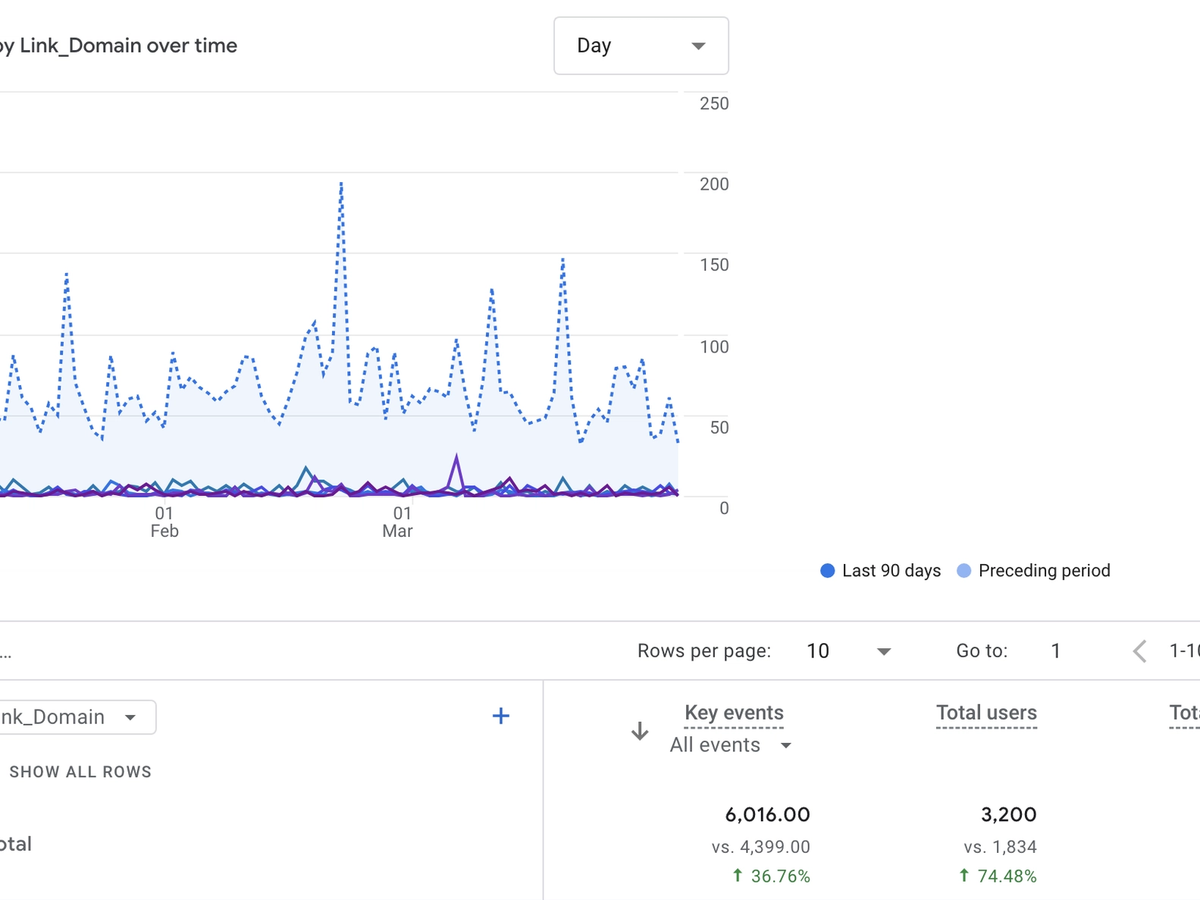
In order to get a broader scope of how your site and its pages are doing, it's best to look at either a 30-day or 90-day period and compare it to the preceding period. Here, we've compared in 90-day increments in order to fully understand the bigger scope of our data.
For the past 90 days, we are up 45.57% of views compared to its preceding period. Active users are up 48.37% . Average engagement time is up 1.78%. This is the amount of views that we are receiving to our overall pages as well as how many people are actively engaging (scrolling, clicking) with our pages.
Our referral events to partner sites are up 36.76% total.
When looking at year/year data, we are up 291.17% for active users, up 164.86% for views to pages, and up 154.01% to referrals to our partners.
There was also recently a Google Core Update that just rolled out towards the end of March (finalized March 27th), so we will continue to keep an eye on trends and optimization with any changes made from an SEO perspective.
Overall, it looks like we're still trending in the right direction! As our valued partners, we will continue to highlight your destinations in the best way that we can. If you ever have any questions or want us to write specific content for your destination, don't hesitate to reach out and let us know!
Thank you all again for your continued partnership.